

Kermit’s commitment to “return the balance of power to hospitals and surgeons” includes providing actionable insights to drive operational improvement, increase efficiency, and produce substantial cost reductions.
Each quarter, Kermit delivers customized business reviews that provide our clients with unique insights into their implant utilization patterns, spend outliers, along with attainable savings opportunities. Led by our Strategic Advisory and Data Analytics teams, this deep dive into our clients’ implant spending data reveals savings opportunities that are not easily revealed in their current analytics platforms due to the uniqueness and complexity of implant data.
Kermit’s quarterly business reviews provide useful information for all stakeholders involved in managing implant spending, including perioperative teams, supply chain, and finance.
Look at these three examples of data visualizations that can be found in a Kermit quarterly business review, including what they can mean for your hospital’s or ASC’s bottom line.
Wasted Items: Not Just A “Cost of Doing Business”
An unfortunate reality in the operating room is that waste happens. Many hospital leaders chalk up waste as simply the cost of doing business, rationalizing every dollar as largely unavoidable. However, if left unchecked, waste can erode the profitability of a case significantly.
Because Kermit collects case data directly from the operating room in real-time, the details behind every wasted item is unlocked, giving hospitals key information to determine what they should really be paying for. Kermit also provides advice on how to talk to vendors and surgeons about waste and can suggest contract language that protects the hospital or surgical center from shouldering the full financial burden of wasted items.
In a Kermit quarterly business review, the assigned Strategic Advisor and data analyst highlight the wasted item trends, showing week-by-week quantities and values.
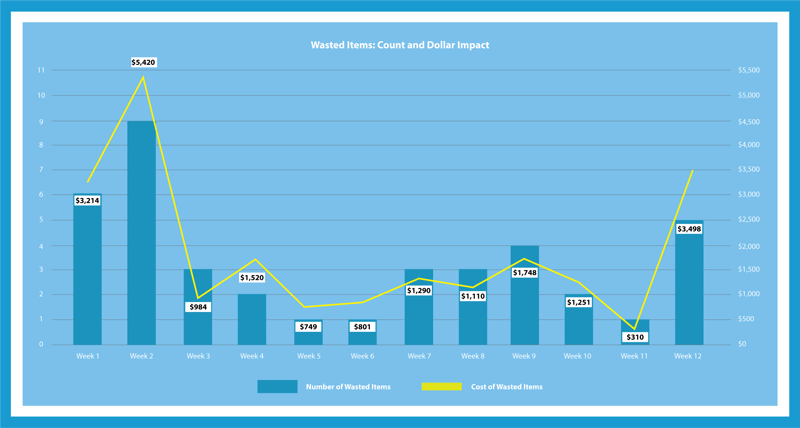
The graphic above is an anonymized recreation of data presented in a Kermit QBR. The blue bars show the count of wasted items in a week, while the yellow line shows the monetary value of those wasted items. Some areas of concern highlighted by our Data Analytics team from this graphic: $22,000 in wasted items annualizes to nearly $100,000, and the count of wasted items early in the quarter appears to have been addressed but is important to keep an eye on.
As this chart gives an overview of the number of items wasted every week in your OR, Kermit also provides visuals that break down the key details of the wasted items, including:
- Reason for Wasted Item: Is the wasted item due to improper fit, opening the wrong item, or another reason? Was it wasted by the surgeon or the vendor representative? Based on your contract terms, that can be very important!
- Who Creates the Most Waste in Your O.R.?: Even though waste is something that happens, it is important to keep an eye on the sources and trends. Is there a perioperative staff member who has an abnormal amount of wasted items? Is there a surgeon-vendor representative combination that has a higher frequency of waste? Do certain procedures and surgical approaches lead to more wasted items?
Unfortunately, some level of wasted items in the O.R. is inevitable, but not all waste is unavoidable or even the fault of the hospital. As reimbursement for surgical procedures continues to erode, focusing on waste in the O.R., especially for high-cost implantable items, pays off in higher margins per procedure.
Delayed Case Entry: Grading Your Vendor Representatives
Even in this era of tight supply chains and high demand, being a supplier is a privilege. Vendor representatives should be respectful of their relationship with their buyers by submitting bill sheets accurately and in a timely manner. Submitting bill sheets shortly after the case, ideally on the same day, acknowledges that staff processing these bill sheets are better equipped to complete this task if the information is timely and error-free.
Using our proprietary CaseSnap mobile application, Kermit monitors the time it takes for vendor representatives to submit their bill sheets for payment and assigns a grade to the vendor rep based on their timeliness. Our clients are alerted to non-compliant reps while shining a positive light on those that consistently submit bill sheets on time.
Kermit’s quarterly business reviews include a weekly view of how each vendor fares with respect to timely submission of bill sheets, including the number of times they submitted a case late based on the customer’s requirements for timeliness.
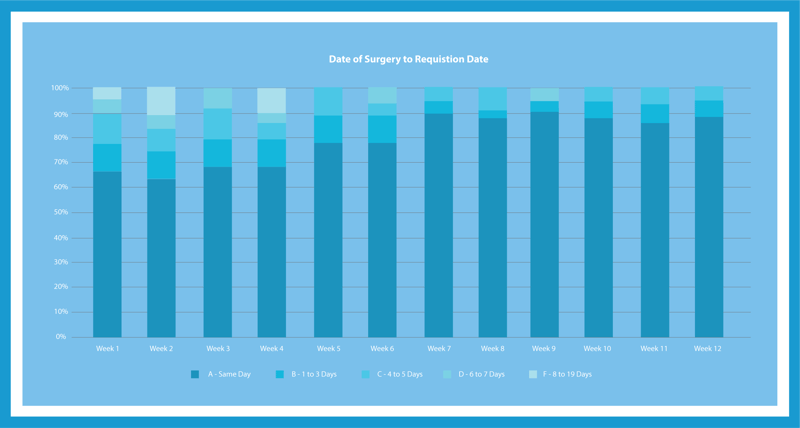 The graphic above is an anonymized recreation of data presented in a Kermit QBR that shows the proportion of same-day case entries from implant representatives to delayed entries. This graph shows the impact of the corrective action taken by Kermit and the hospital to enforce same-day case submission. While weeks 1 through 4 showed a suboptimal amount of same-day entry, weekly improvement continued throughout the end of the quarter. Ultimately, more work can be done to push the same-day entry total closer to 100%, which is Kermit’s goal.
Case Cost Variances: Same Surgery but Different Physician & Cost?
A leading cause of inflated costs can be attributed to the types of implants used, often for highly similar procedures with identical outcomes.
Whether a primary total knee is mobile or fixed-bearing, cemented or cementless can drive significant cost variance, so grouping these procedures into like categories is critical to pinpointing variances in cost. This grouping of cases into specific categories also allows for a more granular evaluation of utilization and costs while avoiding the proverbial “apples” and “oranges” comparisons of cases.
With an industry-leading classification taxonomy for both procedures and products, Kermit provides granular analysis of average case costs for specific surgery types. For example, the table below highlights the average cost by procedure type for cases that were billed either as fully capitated (“CAP”), capitated with some add-ons (“CAP Plus”), or fall completely outside the cap construct (“Itemized”). The report shows that there were 69 CAP Plus cemented fixed-bearing total knee procedures that cost nearly $1,200 more per case than the established cap construct.
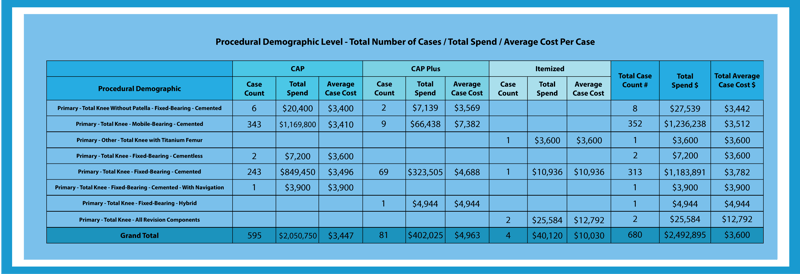
The graphic above is an anonymized recreation of data presented in a Kermit QBR. The data table shows the demographic breakdown of the 680 primary total knee procedures performed in a client hospital during the most recent quarter. Because Kermit applies detailed procedural demographics to each case, exact case comparisons are possible and allow for accurate case cost comparisons and highlighting of billing type differences. In this table, our Data Analytics team noted the large amount of fixed-bearing cemented cases billed as CAP Plus and its associated price increase.
Kermit provides in-depth information to identify surgeons, manufacturers, reps, and items used for hospitals and ASCs to have the needed conversations to curb this behavior.
Customized Quarterly Business Reports for Each Client
Kermit QBRs provide valuable insights into implant spending and utilization patterns, vendor performance and compliance, and detailed information on case costs. In addition, each QBR is customized for each client’s unique characteristics with specific and actionable recommendations for reducing costs and improving outcomes.
Kermit’s team of Strategic Advisors takes a hands-on approach to help our clients in their cost-reduction efforts. That includes frequent interactions between scheduled QBR meetings. Kermit’s Strategic Advisors have a keen understanding of existing questions or pain points that can be solved by taking a deep dive into the data and researching opportunities for improvement.
Data Reports You Can Receive Before Working with Kermit
And while QBRs are for clients, Kermit can perform audits and analyses for hospitals and health systems that want to understand how Kermit can help reduce costs and increase margins. This may include a process assessment to identify opportunities to streamline the bill-only process and reduce errors that lead to vendor overpayments or an analysis that benchmarks historical purchases of implantable medical devices and identifies opportunities for price reductions (average savings range from 20% to 30%).
Interested in a bill-only process audit, a purchase order analysis, or both with Kermit? Complete the form below.