

Pop quiz: Using data you have access to, answer the following questions:
- Are there Implant cost variances between spine surgeons for 1 Level TLIF + Cage procedures and if so, why?
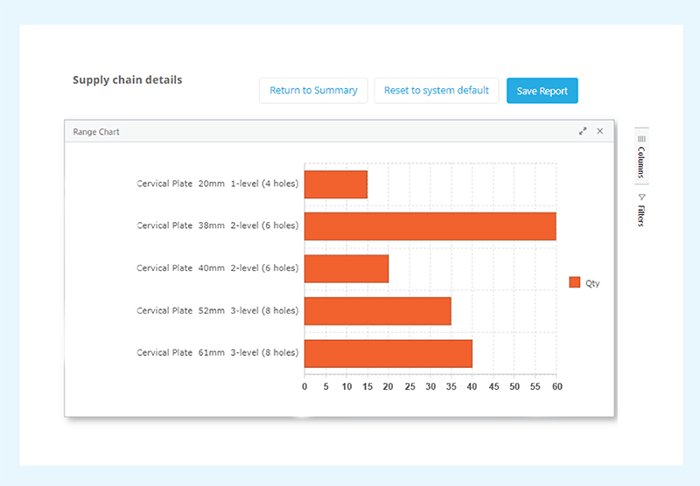
- In the past year, how many 52mm 3-level, 8-hole cervical plates were used?
- What is the value of your wasted implants in the last 30 days and how much is attributable to the vendor versus your medical staff?
- Which of your vendor representatives violate implant procedure and billing policies?
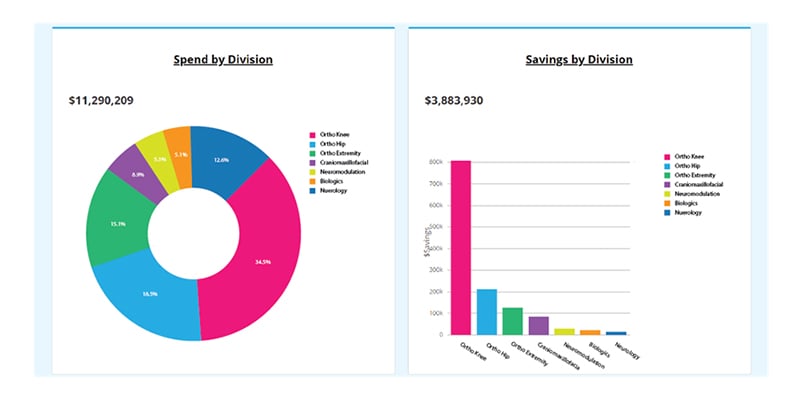
- Which surgical division has yielded the most savings? Which has yielded lower than expected savings and why?
While such questions may feel more like pub trivia than something your hospital supply chain should know, having access to these data points is crucial to transforming your implant spend, revealing significant savings opportunities and establishing credibility of the supply chain in all clinical and financial departments.
The truth is many hospitals and health systems may have a difficult time providing a confident answer for even just one of these questions. Responses regularly involve multiple data from disparate sources that need to be matched up in spreadsheets or other desktop tools, assuming someone is assigned to clean the data and assemble the analysis. Often, the analysis is so tedious and untimely that the value is low.
Getting Transformational: Compare Exact Case Matches to Find Spend Outliers
Are there Implant cost variances between spine surgeons for 1 Level TLIF + Cage procedures and if so, why?
When making analytical comparisons, it is important to know you are comparing apples to apples.
Many hospitals today can compare case costs amongst their spine surgeons and can even identify which surgeon may be the ones driving costs higher. However, confidence in available cost accounting data sets is low. We have seen examples time and again where surgeons easily poke holes in the data simply by challenging technical aspects of surgery type, approach, pathology, implant nuances and other clinical demographics. One common refrain is “my case costs are higher because I handle more complex cases than the other surgeons.”
Having the ability to compare case costs of like surgeries and drilling down to a degree of procedural specification will allow you to make precise comparisons and prevent pushback from surgeons.
The question in our pop quiz is a great example of this. Instead of telling one of your spine surgeons that their implant costs are 20% higher than the rest of the surgeons, you can say that their case costs are the highest for spine instrumented/interbody procedures in the lumbar region, specifically for 1 level TLIFs where a specific brand of cage is used, further punctuating your statement by showing the vendor’s billing data. This approach honors the surgeon, recognizes any potential variances in vendor brands or specialty technologies and shows you know your stuff.
Achieving Transformation with Kermit:
The lack of visibility into utilization and spending for medical devices starts with a lack of detailed case, procedure and device information…information that is locked within a paper bill-sheet (or digital image of the same) and nowhere else. When Kermit digitizes your bill-only process, we capture key information at a granular level at the point of use making advanced analytics possible.
Why is it important to know the specifics of each type of procedure, surgical approach and the implantable devices used in surgery? In short, these details are critically important in setting meaningful cost and utilization benchmarks and for having constructive discussions with your surgeons. For example, defining lumbar TLIF surgeries by the number of levels and the use of a cage allows supply chain executives to make direct cost comparisons and speak the language of the surgeon. This leads to collaboration in finding savings opportunities.
This granular method of case classification can be applied to total joints, cardiac rhythm management, trauma or any surgical category that involves implants.
Data Visualization in Kermit:
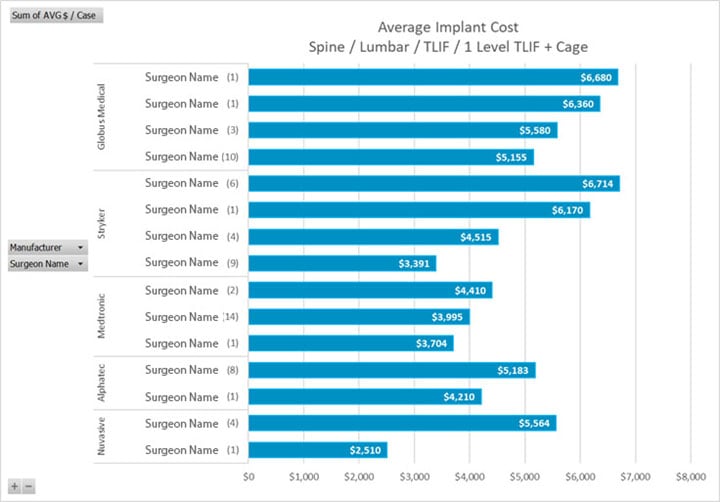 Figure 1 - Lumbar TLIF 1 Level + Cage Cost Variation by Surgeon and Implant Vendor
Information is Power: Arm Yourself for Your Next Round of Negotiations
In the past year, how many 52mm 3-level, 8-hole cervical plates were used?
Why does this level of analysis matter? Consider your most recent vendor implant negotiation in spine. The pricing submitted was higher than your benchmarking data suggested. They counter with this solution: At your current spend, we can meet the price on the six-hole plate, but there isn’t much we can do on the cost of the eight-hole cervical plates.
On paper, this sounds like a victory. According to the rep, you will be using far more six-hole plates than eight-hole plates, anyway. But what you cannot see (and what your rep can) is that your surgeons have been steadily increasing their use of eight-hole cervical plates and the projected volume combined with contracted pricing more than make up for the 20% “discount” received.
This scenario happens frequently at every negotiation and in varying degrees, putting our hospital supply chains well behind the cost-reduction eight ball even before the ink is dry on the new vendor agreement. Anticipated savings go unrealized, surgeon-supply chain partnerships are weakened and budgets take another annual hit.
Access to reliable analytic tools that connect detailed clinical demographics to surgical billing arm you with the information needed to balance the information deficit between your organization and the big device manufacturers. The vendors have this information when they develop your proposal. Shouldn’t you have access to the same data?
How Kermit Makes Transformation Possible:
In addition to capturing case and procedure data, Kermit also captures details on every implant product used, providing at-a-glance dashboards, key performance indicators and spend analytics. This is done through a proprietary, best-in-class procedure and product classification taxonomy that organizes specific surgical procedures and approaches with like-products down to as many as 7-layers of specification, regardless of manufacturer.
How this looks in Kermit:
Proactively Addressing Waste is the Low-Hanging Fruit of Cost Reduction
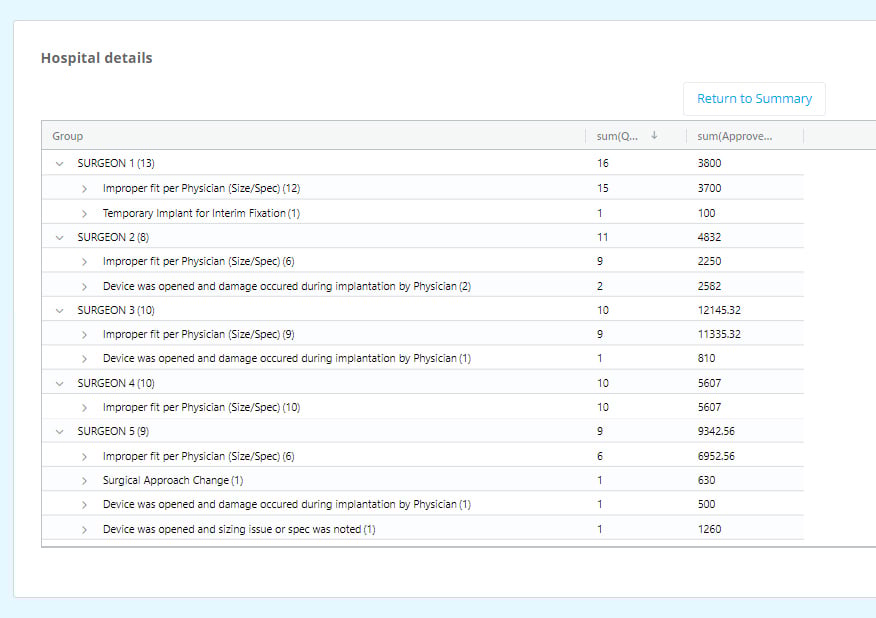
What is the value of your wasted implants in the last 30 days?
Unfortunately, it’s not uncommon for implantable items to be wasted in the O.R. Paying for this waste is avoidable and easy to surface and address with the proper tools.
An advanced analytics view can isolate your wasted items by wasted reason, vendor reps, device, surgeon, procedure, and more. Dashboards can show which combination of surgeon and device rep are leading to the most waste. For example, you may find that a specific surgeon is responsible for 60% of your total wasted items or that surgeries involving a particular vendor rep are three times more likely to have a wasted item.
Finding these trends, asking the right questions, and finding solutions can be a great opportunity to reduce your PPI spend, increase margins, and minimize unnecessary waste in your O.R.
How Kermit makes it possible:
Another result of Kermit revolutionizing your bill-only process is the monitoring of wasted items. Not only are these items logged and tracked, but the circumstances around what caused the wasted item(s) are reconciled with negotiated contract terms to ensure that contract rules for waste are followed.
How this looks in Kermit:
Uncover the Contract Compliance Issues Committed by Vendor Reps
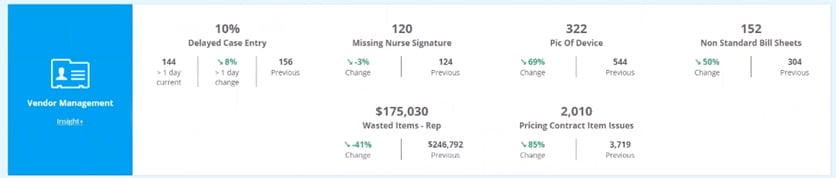
Which of your vendor representatives violate implant procedure and billing processes?
As we have covered previously, the bill-only process is wrought with potential for error and compliance issues. However, once those paper bill sheets are delivered to purchasing, they are often processed without documenting the compliance issues created by the vendor rep.
Why does this matter? These errors and compliance issues of course add up, eroding the savings you’ve negotiated, and negatively impacting margins. These compliance issues also tax your already overburdened staff who must track-down and resolve issues like late or incomplete bill sheets, off-contract items, missing nurse signatures, pricing inaccuracies and others.
Having advanced analytics – and a digitized bill-only process powering it – hospitals can automate the monitoring of these compliance issues, tying them directly back to the representative and correcting bills on the front end before they become invoice discrepancies.
How Kermit makes it possible:
With Kermit, hospitals can build rules that vendor reps must follow, including rules that will halt the issuance of a purchase order. These rules include submitting the case to Kermit within 24 hours of the surgery, using the Kermit app to securely transmit an image of the bill sheet, and obtaining the nurse’s signature to validate the bill sheet.
In addition, Kermit uses artificial intelligence to power business and contract rules so that each bill sheet is checked against your specific vendor contract terms, correcting charge inaccuracies, and flagging off-contract items before being routed to purchasing for approval.
Compliance issues are tracked in real-time and trended in order to curb unwanted behavior before it compounds. Additional drilldown also provides insight into which reps, vendors and surgeons are the ones most likely to create these issues.
How this looks in Kermit:
Dive Into Your Realized PPI Savings
Comparing this month to the same month last year, in which surgical division have you realized the most savings?
You’ve done all the hard work of securing favorable pricing, reducing case cost variance, and cracked down on non-compliant vendors. All these actions, if done right, should result in realized year-over-year savings in your implant spend. The only thing to figure out: how do you track the savings?
Of course, the same analytics dashboard in which you found all these opportunities will also track savings by division, vendor, and surgeon and for any desired date range.
How Kermit makes it possible:
Whether Kermit is transforming your bill-only process or also involved in your negotiations, real-time PPI savings reports are available at any time within our cloud-based application. Imagine being asked the important question during a meeting by a surgeon, CMO or CFO “how much did we save last quarter in spine” and being able to cast accurate numbers to the screen from your mobile device.
How this looks in Kermit:
Want to Learn How Kermit Can Enhance Your Implant Analytics?
Kermit has experience working with highly-varied environments from rural hospitals, community and regional medical centers, academic health systems and large integrated delivery networks. Learn how we can tailor our approach to you. Fill out of the contact form below to learn more.